Page Details: Your Deep Dive into Website Performance
Welcome to the Page Details report! This is where you can really get under the hood of a single web page and understand exactly how it's performing. Think of it as a detailed health checkup for your website, showing you what's working well and where you can make improvements to boost speed, SEO, accessibility, and best practices. This report helps you understand the finer details of your website’s performance metrics. Let’s break it down section by section.
Accessing the Page Details Report
Getting to the Page Details report is easy! Here's how you do it:
-
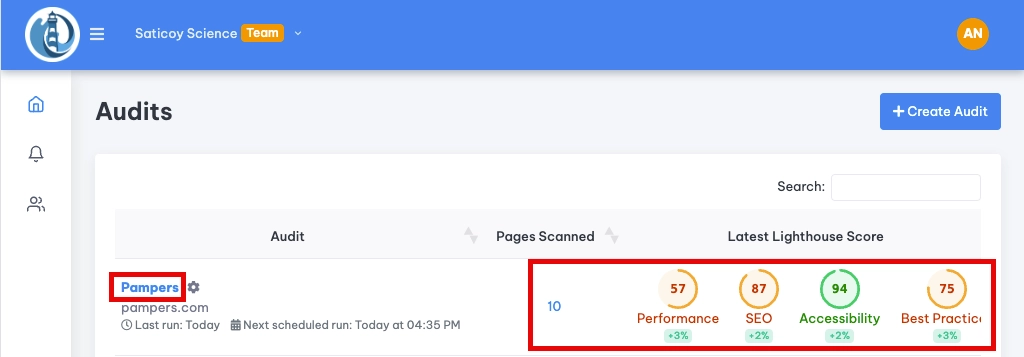
Start at Your Dashboard: Log into your LighthouseBeyond account and you'll land on your main dashboard. This gives you a bird's-eye view of your website's performance.
-
Choose an Audit: From your dashboard, select the audit you want to explore. This will take you to the Audit Overview page.
-
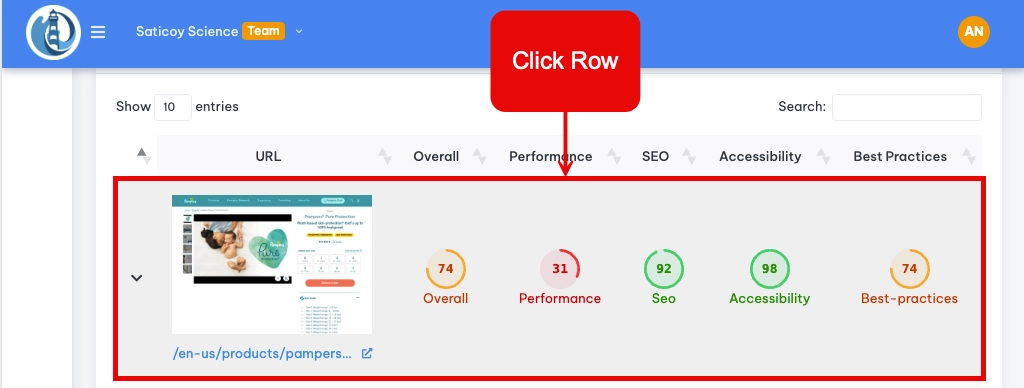
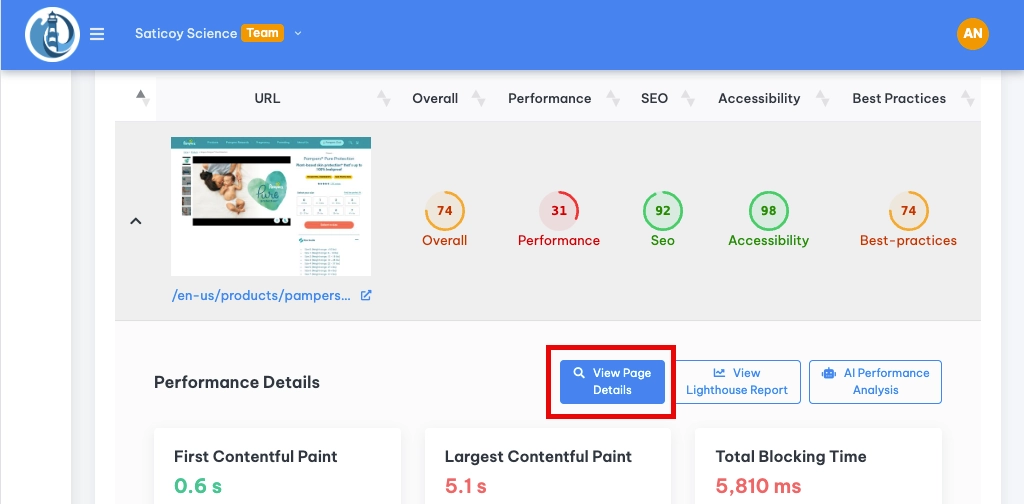
Drill Down to Page Details: On the Audit Overview, you'll see a list of all the URLs included in that audit. Find the page you're interested in and click the "View Page Details" button next to it. This will open up all the detailed information about the pages individual performance.
Breaking Down the Page Details Report
The Page Details report is packed with insights, but don't worry, it's easy to navigate. Here is what each section is and how it helps you:
View the Lighthouse Report
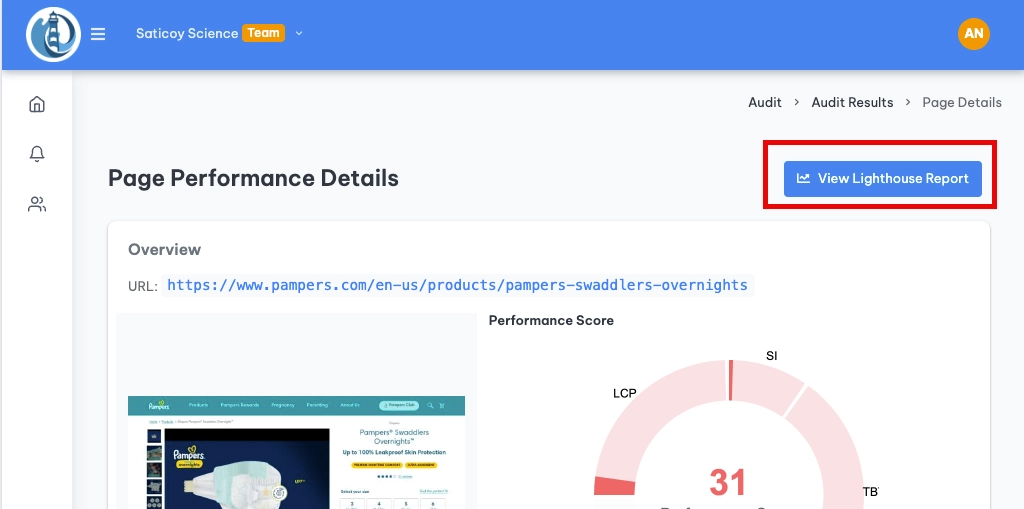
At the top of the Page Details report you will see a button labeled "View Lighthouse Report". While much of the same information is presented throughout the Page Details Report, the lighthouse report serves as a helpful reference. Clicking this button will open a new tab in your browser that shows the full Lighthouse Report.
Lighthouse Performance Score Chart: Your Page's Report Card
At the top of the page, you'll see a colorful chart showing your overall Lighthouse Performance score. This is like a report card for your page, giving you a quick overview of how well it's doing.
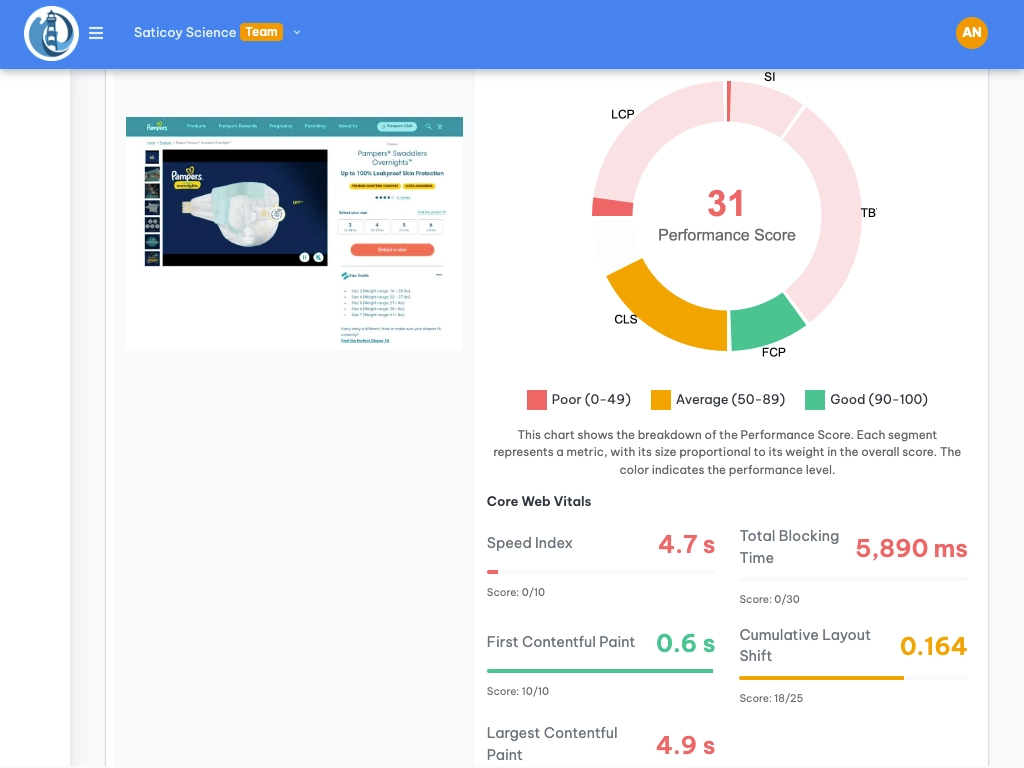
The chart breaks down the score into key performance metrics:
- Speed Index (SI): How fast does your page look like it's loading? A lower number is better! This contributes to 10% of your total score.
- Total Blocking Time (TBT): How long is your page unresponsive to user actions like clicks and taps? Less blocking means happier visitors. This is a big one, accounting for 30% of your score.
- First Contentful Paint (FCP): How quickly does the first bit of content appear on the screen? It contributes to 10% of the total score.
- Cumulative Layout Shift (CLS): Does your page content jump around as it loads? A lower score here means a more stable and visually pleasant experience, making up 25% of your score.
- Largest Contentful Paint (LCP): How long does it take for the biggest element (like a hero image) to show up? This is important for user experience and accounts for 25% of your overall score.
Each of these metrics displays an individual score and its weighed according to its effect on the overall Lighthouse Performance Score. For example, the highest possible score for Total Blocking Time would be 30, since its weighed to make up 30% of the total score.
Decoding the Colors:
- Green: You're in the green zone! (90-100) Keep up the good work!
- Orange: Needs a bit of a tune-up. (50-89) There is room for improvement!
- Red: Uh oh, some areas need urgent attention! (0-49) But don't worry, we'll help you fix them.
Page Load Timeline: See Your Page Load in Action
Below the chart, you'll see the Page Load Timeline. This is like a visual timeline of your page loading, showing you exactly what's happening at each moment.

- Screenshots: You'll see snapshots of your page as it loads, like a flipbook.
- Timestamps: Each screenshot has a timestamp, so you can see precisely when each stage of the loading process occurred.
Key Metrics Highlighted:
- Server Response Time: This shows how long it takes for your server to start sending data back to the browser. A fast response is crucial! High response times may indicate server-side issues.
- First Contentful Paint (FCP): The timeline highlights when the first content appeared on the screen. This lets you see how long users may wait until they see content.
- Largest Contentful Paint (LCP): This pinpoints when the largest element loaded, with the exact time displayed below it.
AI Performance Analysis (Beta): Your AI Optimization Expert
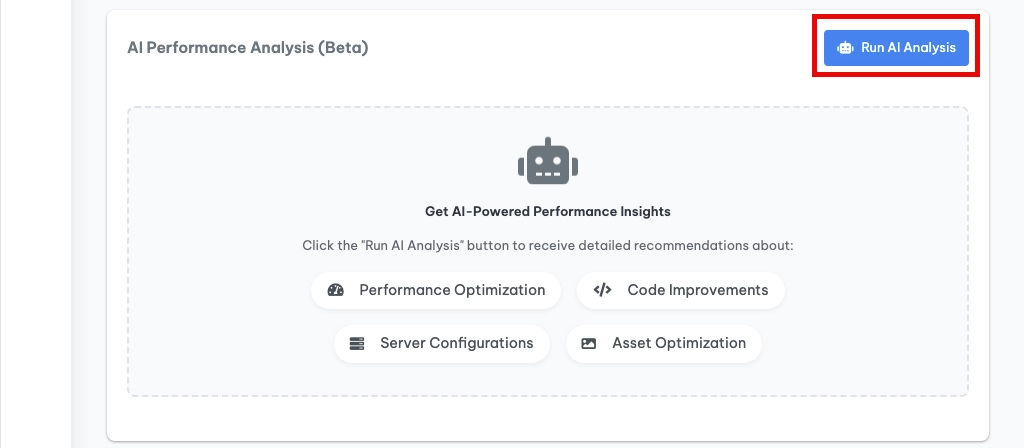
This section is like having a web performance expert on call! Our AI analyzes your page's data and gives you personalized recommendations on what to fix first.
What Makes It Awesome:
- Focuses on Your Biggest Pain Points: It hones in on the areas where your page is struggling the most. For example, if your Largest Contentful Paint (LCP) is low, the AI will focus on suggestions to fix it!
- Prioritized Suggestions: It doesn't just give you a laundry list; it ranks the recommendations by their potential impact, so you know what changes will make the biggest difference.
- Still in Beta: Since this feature is brand new, it takes a few moments to generate its recommendations. We're constantly improving it, so your feedback is invaluable!
Prioritized Lighthouse Audit Results: Your To-Do List for a Faster Page
This section provides you with the Lighthouse Audit Results in a specific order to make it easier to focus on the most important changes first. They are broken down by High, Medium, and Low priority. It's like a to-do list for optimizing your page!
- High Priority: These are the most critical issues affecting your page's performance. Fix these first for the biggest boost!
- Medium Priority: These are still important but have a slightly smaller impact than the high-priority items.
- Low Priority: These are worth addressing eventually, but they're the least urgent.
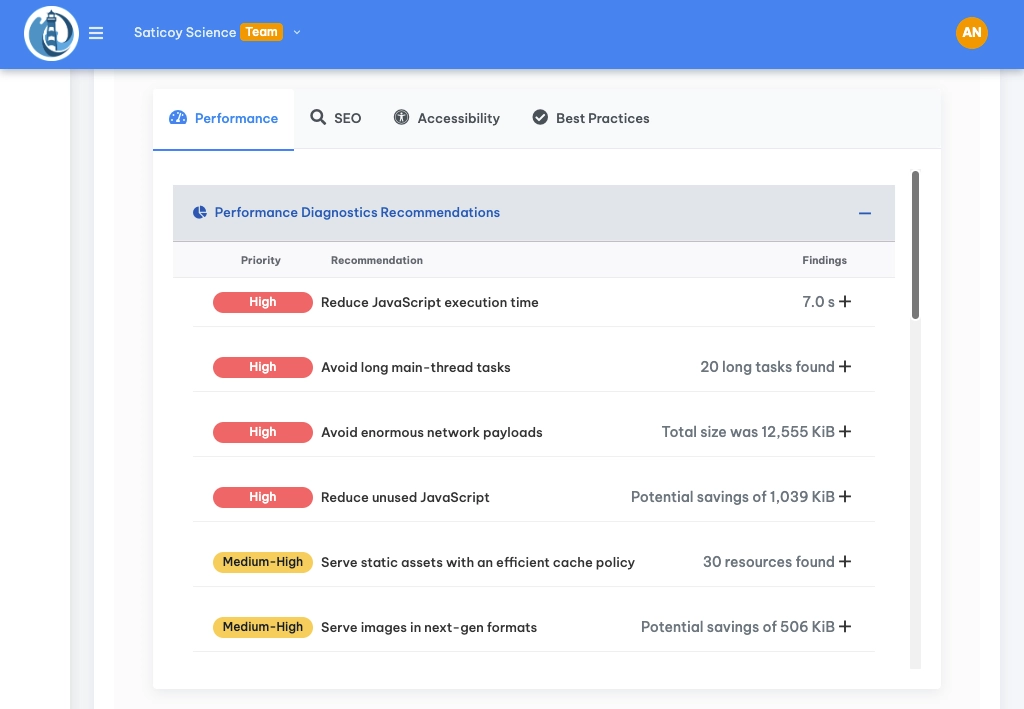
We recommend starting with the High Priority items to see the biggest changes to your score.
SEO, Accessibility, and Best Practices Tabs: Beyond Performance
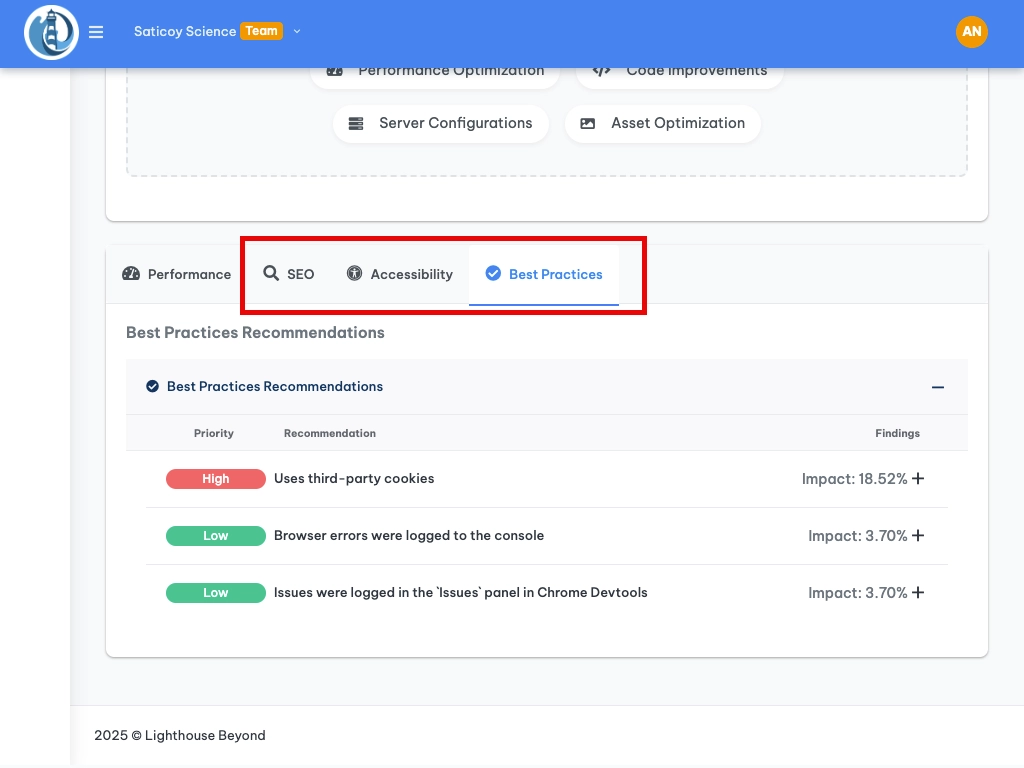
The Page Details report isn't just about speed! We also have tabs dedicated to SEO, Accessibility, and Best Practices.
- SEO: See how well your page is optimized for search engines. Each recommendation shows you how much it could improve your score. For example "Make sure your page has a title element" may increase your score by 5%.
- Accessibility: Make sure your page is usable for everyone, including people with disabilities. Fixing accessibility issues not only makes your site more inclusive, but it can also improve your overall scores!
- Best Practices: These are general recommendations for improving the overall quality and security of your website. Similar to the other tabs, recommendations come with potential score improvements, for example "Removes usage of third-party cookies" may boost your score by up to 9%.
These sections don't just tell you what's wrong; they show you the potential impact of fixing each issue. Look for items with the highest impact scores in these sections to maximize your improvement efforts.
Start Optimizing!
The Page Details report gives you everything you need to make your website faster, more user-friendly, and better optimized. Dive in, explore the data, and start making those improvements! If you have any questions, don't hesitate to reach out to our support team. We're always happy to help!
