Understanding Your Audit Overview Report in LighthouseBeyond
This guide will walk you through the Audit Overview Report, your go-to resource for understanding the health and performance of your websites. We’ll break down what each section means and how you can use this information to make your sites faster and more user-friendly.
Getting to Your Audit Overview Report
Think of the audit dashboard as your command center. Here, you'll see a snapshot of all your sites and their audits.
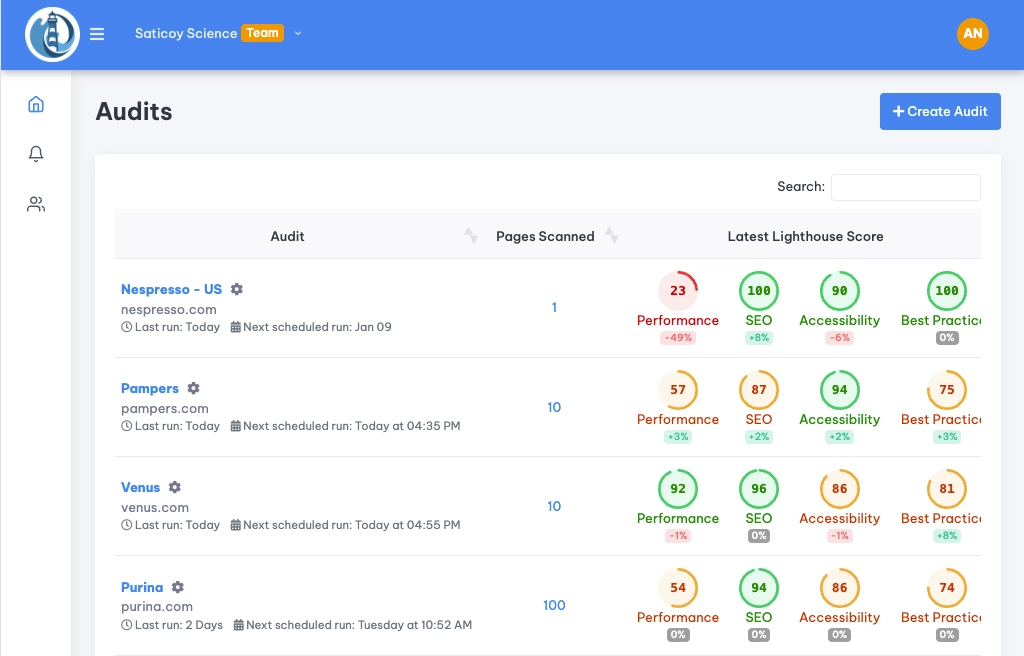
- Last Ran/Next Run: Tells you when your last audit happened and when the next one is scheduled. Keep an eye on this to make sure your audits are running as planned!
- Lighthouse Scores: You'll see scores for Performance, SEO, Accessibility, and Best Practices. These are like quick health checks for your site.
- Pages Scanned: Shows how many pages were checked during the last audit.
- URL: The domain of the report which was scanned.
To dive into the details of a specific audit, just click on any of these elements (Lighthouse scores, number of pages, or URL) for the report you're interested in.
Inside the Audit Overview Report
Once you’re in, you’ll see some key details about your audit setup:
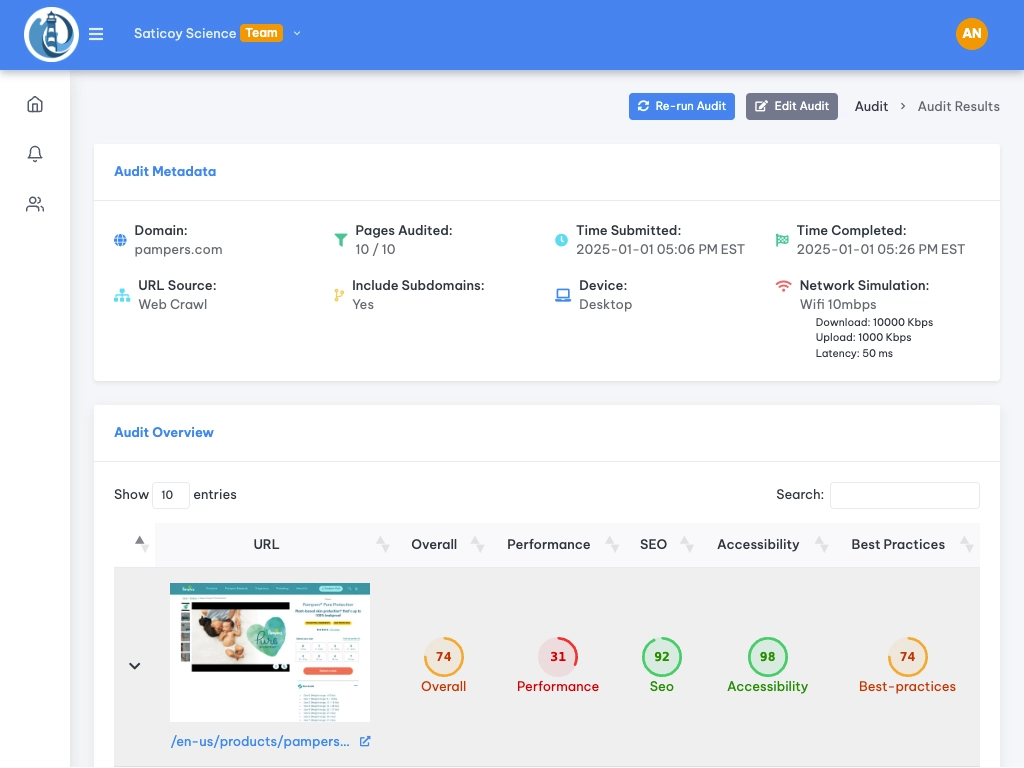
- Pages Scanned: The number of pages included in this audit.
- URL Source: Tells you how we found the pages to audit—either by crawling your website (Web Crawl), using a CSV you provided, or using an XML sitemap. If you choose a web crawl LighthouseBeyond will automatically crawl all of your pages, up to 1000. Alternatively you can choose enter an XML sitemap or upload a CSV in the settings tab of your audit.
- Device: Whether we tested the pages on desktop or mobile. When you create an audit you can choose between mobile or desktop for the device.
- Network Simulation: This simulates different internet speeds (e.g., Slow 4G, Fast 3G). It helps you see how your site performs under various conditions. We default to Slow 4G so that you get an idea of your site loads on slower connections. This can be changed in your audit's settings.
Your Site’s Performance at a Glance
Below the audit setup, you’ll find a list of all the pages that were audited.
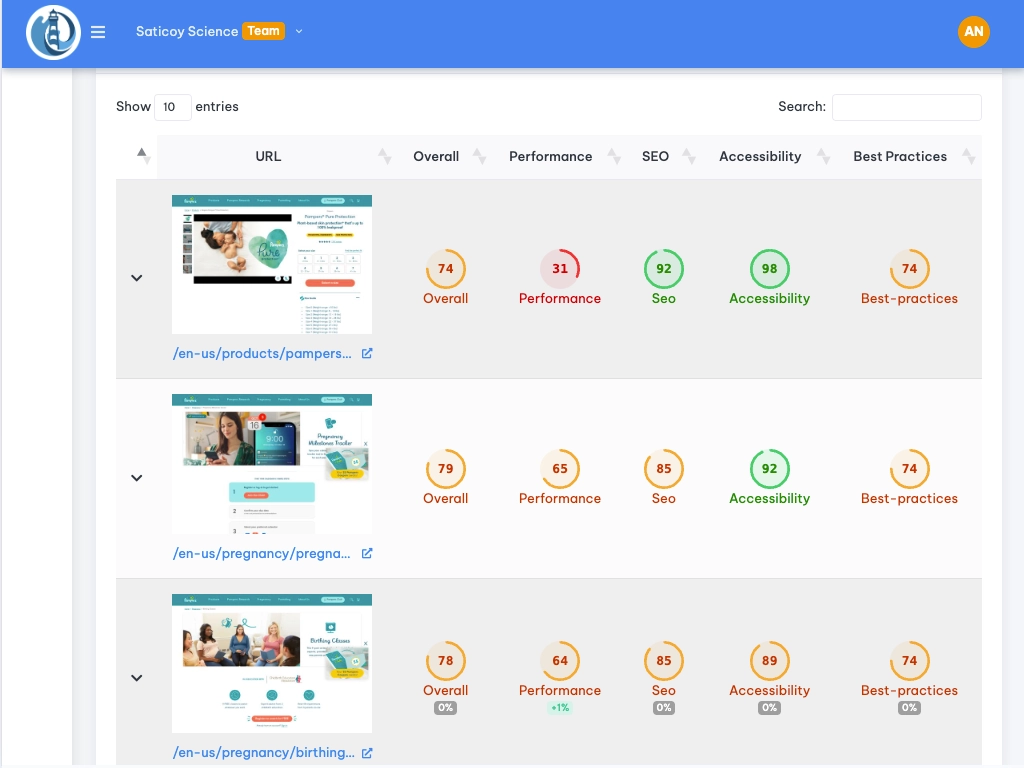
- Overall Average Scores: This gives you a quick summary of how your site is doing across Performance, SEO, Accessibility, and Best Practices.
- Individual Page URLs: Each row represents a page that was audited.
- Sortable Columns: You can sort the list by any of the score columns (Overview, Performance, SEO, Best Practices, and Accessibility). This is super helpful for spotting your top-performing or underperforming pages quickly.
Drilling Down into Page Performance
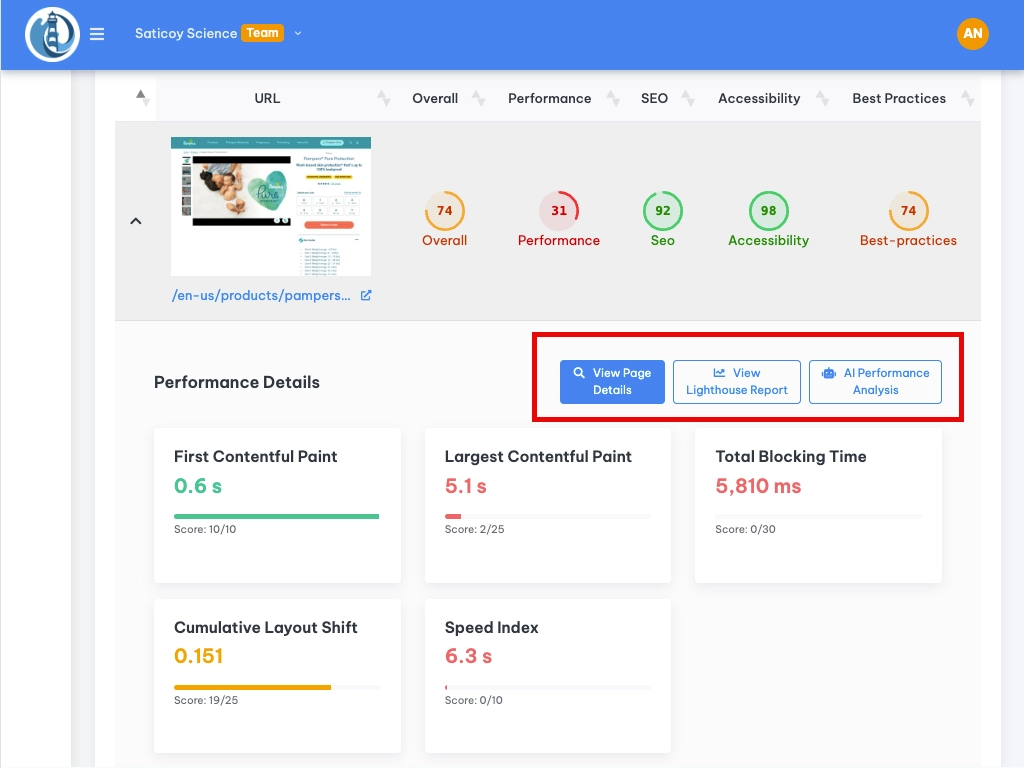
Clicking on any row expands it to show more detailed performance metrics for that specific page.
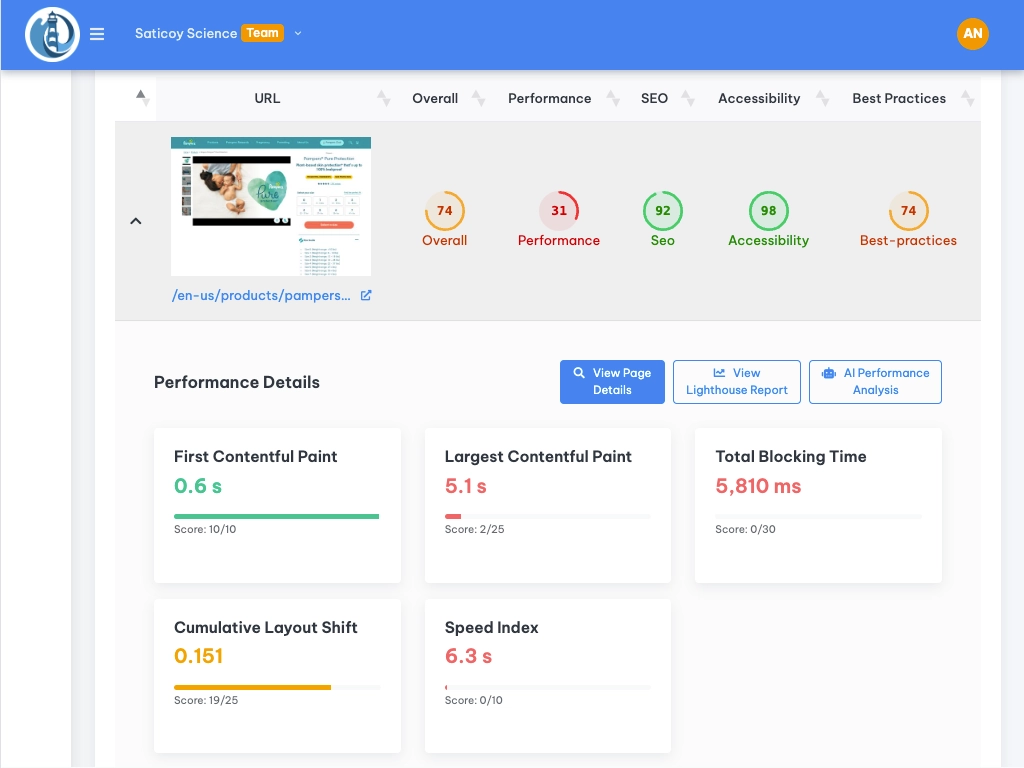
- Largest Contentful Paint (LCP): How long it takes for the main content of your page to load.
- First Contentful Paint (FCP): When the browser first renders any content, like text or images.
- Total Blocking Time (TBT): Measures how long a page is blocked from responding to user input. A low TBT is key for a smooth user experience.
- Cumulative Layout Shift (CLS): Tracks unexpected shifts in the layout of your page during loading. You want this to be as low as possible to avoid a jarring user experience.
- Speed Index: How quickly the contents of a page are visibly populated.
Unpacking the Results with Lighthouse Audit Details
Now, let's get to the heart of it—the Lighthouse Audit Details section. For each page, you can view in-depth performance results, which are prioritized to show you what to tackle first.
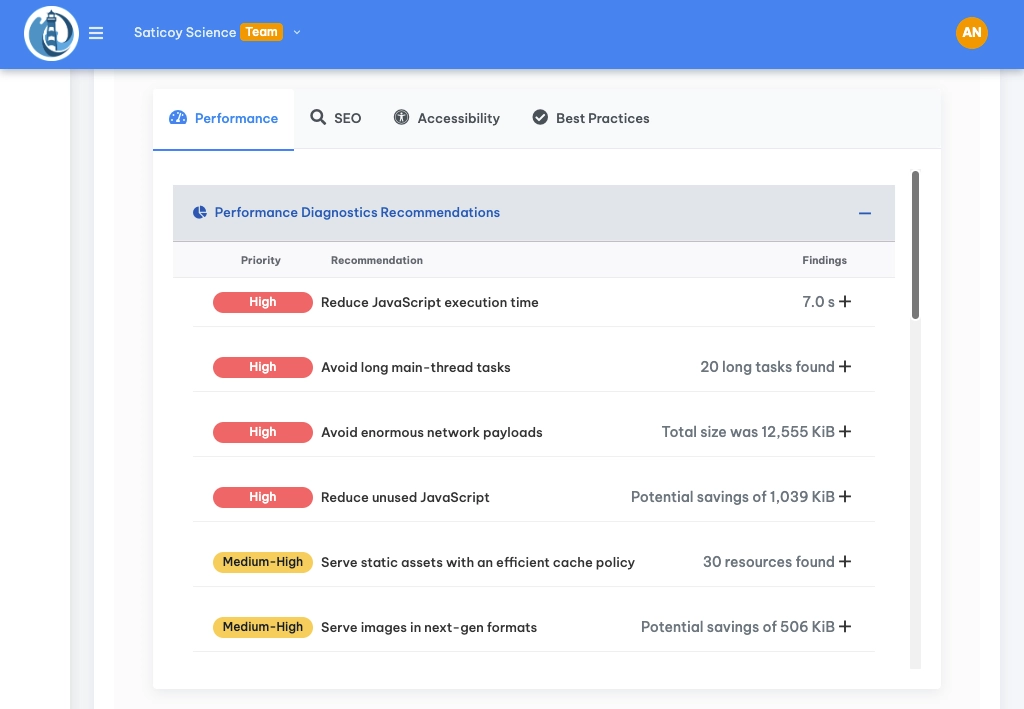
- Custom Priority Sorting: Unlike the standard Lighthouse report, we sort performance issues based on their potential impact. We consider factors like your LCP score and other performance details to determine what should be your top priority. For example, if your LCP is slow, we might bump up issues related to render-blocking resources.
- Performance, SEO, Accessibility, Best Practices Tabs: Each tab provides a detailed breakdown of the respective category.
Impact Scores
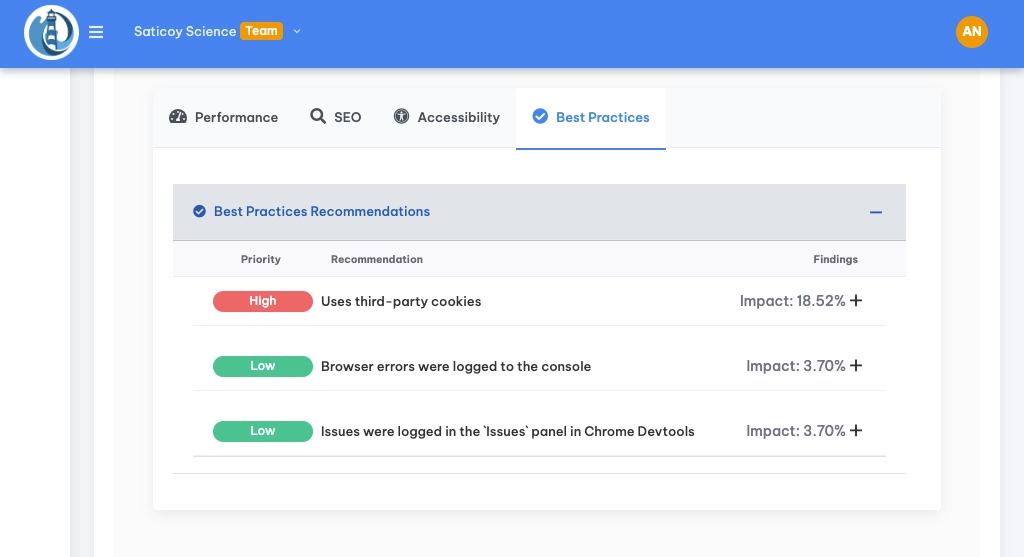
In the SEO, Accessibility, and Best Practices tabs, you'll see an “Impact Score.”
-
Impact Score Explained: This tells you how much a specific issue affected your Lighthouse score. For example, an impact score of 20% means that fixing this issue could potentially improve your score by 20%. So, aim for those high impact scores first!
- Tip: Focus on the items with the largest impact score for the biggest improvements to your Lighthouse score.
Digging Deeper: Buttons for Further Analysis
You'll see three buttons in this section, each designed to help you explore further:
-
View Lighthouse Report: This takes you to the original Lighthouse report for that page. It’s great if you want to see all the raw data.
-
View Page Details: This opens a more detailed analysis of the individual page’s performance, helping you pinpoint exactly what’s going on.
-
AI Performance Analysis (Beta): Our smart assistant! Click this, and our AI will analyze your data and provide tailored recommendations to improve your scores. It takes up to a minute to run, but it’s worth the wait!
- Note: This feature is still in beta, so we're constantly working to make it even better!
Wrapping Up
The Audit Overview Report is your secret weapon for making your websites faster, more user-friendly, and better optimized for search engines. By understanding and acting on the insights provided, you'll be well on your way to creating top-notch web experiences!
